Cognex Support Hub
In-Sight L38 How to Use 3D Cross Sectional Profiles
How to use 3D profile
04/17/2025
How to use 3D profile
If you want to analyze the freeform surface and the depth of scratches in detail, you can form and analyze a 3D cross-sectional profile line of the part that intersects with an arbitrary plane on the 3D point cloud. When the 3D vision tool → 3D Cross Section→ ExtractCrossSection3D is described in a Spreadsheet cell by clicking and dragging, the property sheet of [Fig 1] is displayed.
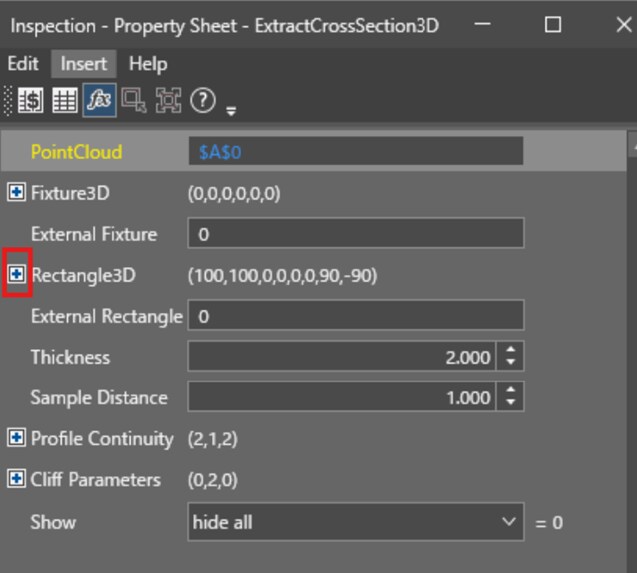
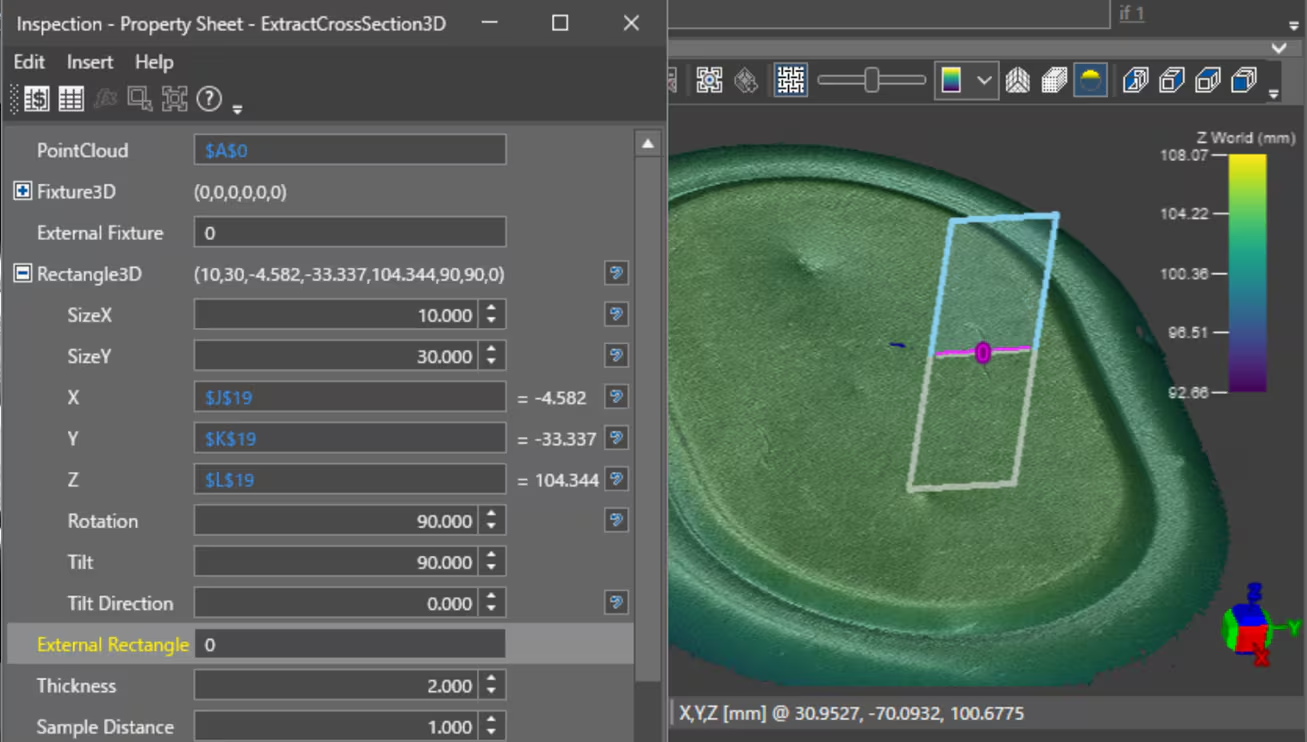
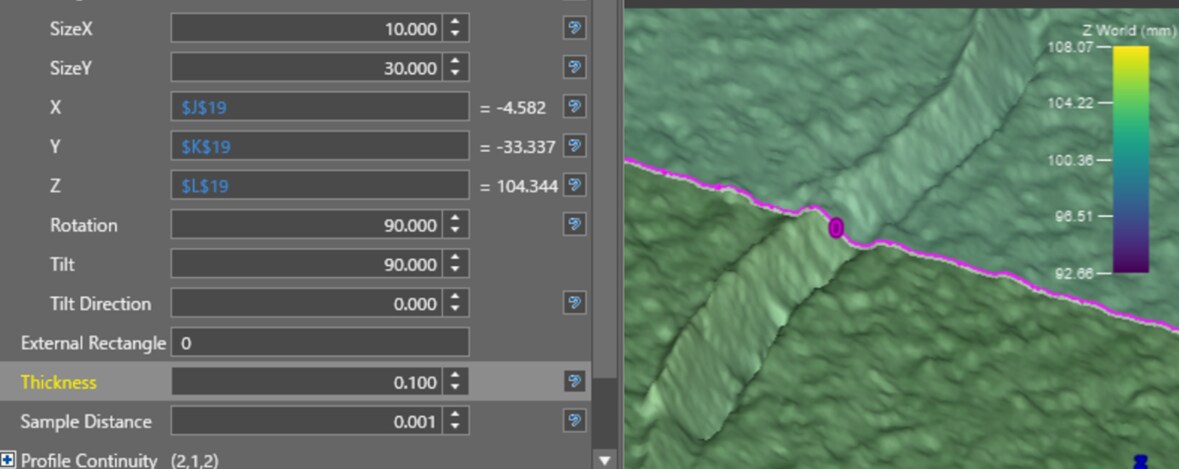
When the + button on the left side of Rectangle3D is opened, the XY size for setting the planar rectangle constituting the cross-section, the position, rotation, tilt, and tilt direction settings for setting the center of the plane rectangle are displayed. The rectangular plane center position is applied by adding the value of Fixture3D, the offset value from the XYZ origin of Rectangle3D, and the distance.
In the example shown in [Fig. 2], the coordinate value (XYZ) of the center of gravity of 3DBox detected by the 3D ViDi EL SegmetTool is set. If the value of the "external rectangle" parameter is set to 0, the value set above is applied as it is to form a rectangular plane.
The "Thickness" parameter is the range of the neighborhood of the target plane used to search for 3D points, and the width range from the slicing plane at the time of profile creation is used for calculation (the thickness of the plane to be cut). Note that the sample distance is a set value of the sampling interval in the slicing plane, and if this value is not appropriate for the size of the target to be measured, the correct cross-sectional profile value cannot be obtained. [Fig. 3] shows the results when the sample distance is set to 1 mm and the result when the sample distance is set to 0.001 mm.
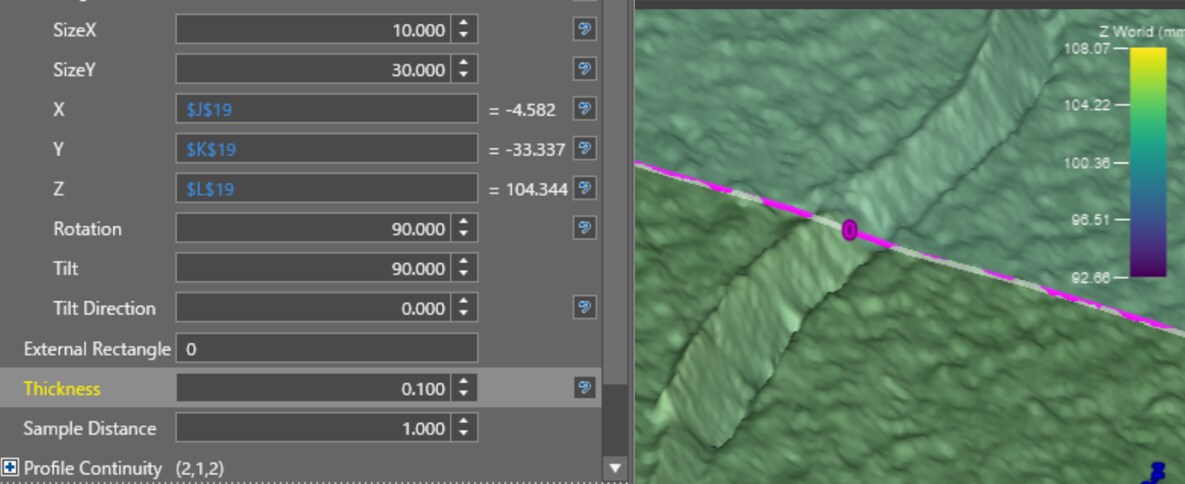
At a sample distance of 1 mm, it is too large for the size to be measured, so the profile is fragmented and the correct profile is not formed. If you set it to 0.001 mm, you can form a profile according to the desired scratch.
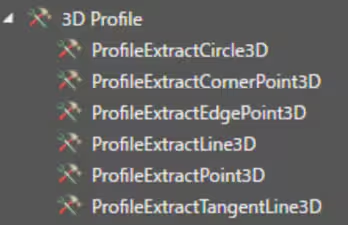
As shown in [Fig. 4], there are six analysis functions using 3D profiles, and analysis using ProfileExtractPoint3D is introduced as an example.
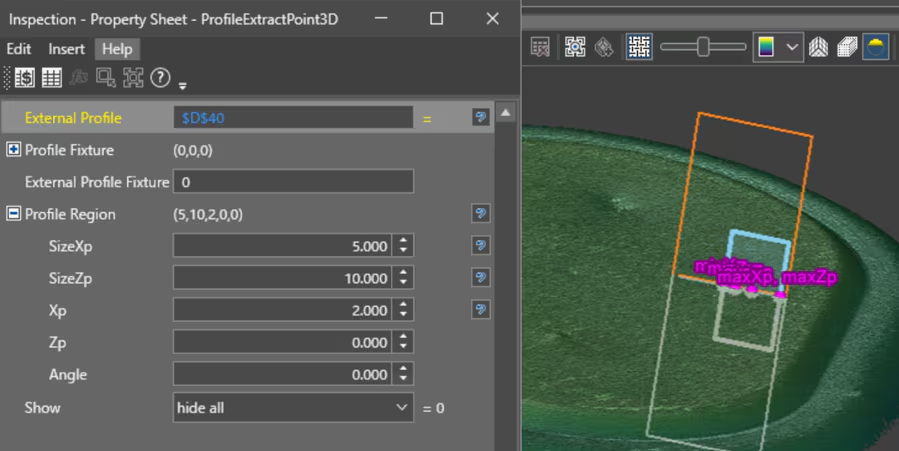
When ProfileExtractPoint3D is described in a cell, the property sheet of [Fig. 5] opens. Browse to the external profile you want to analyze on this sheet. [Fig. 5] refers to the □ Profile created in the D20 cell. Next, set the profile area you want to analyze. SizeXp and SizeZp are the sizes of the rectangular regions used for profile analysis in the profile reference plane, and Xp and Zp are the offset values of the profile area. The orange line is the planar rectangle of the original profile, and the light blue line is the profile area in ProfileExtractPoint3D.
As shown in Fig. 6, when a numerical value is entered and OK is pressed, the points of minimum Xp, maximum Xp, minimum Zp, maximum Zp, and average Zp in the cross-sectional profile are stored next to the cell describing ProfileExtractPoint3D, and the five points are graphically displayed on the 3D point cloud.
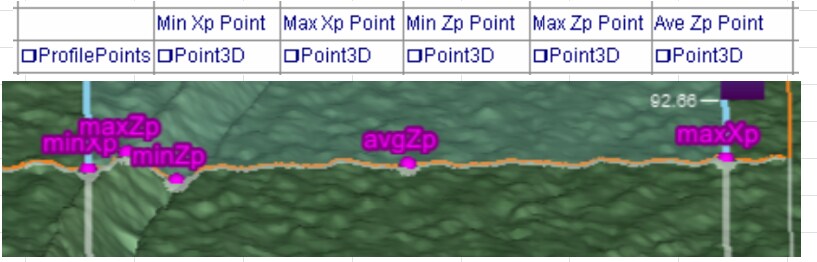
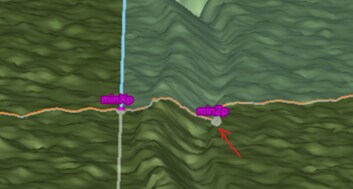
Point3D has an XYZ coordinate value of the point inside, and for example, if you want to obtain the Z value of a point having the smallest Z value on the profile indicated by minZp in [Fig. 7], you can get the Z value of the scratch you want to measure by referring to the □Point3D cell of this minZp with the GetZ function.
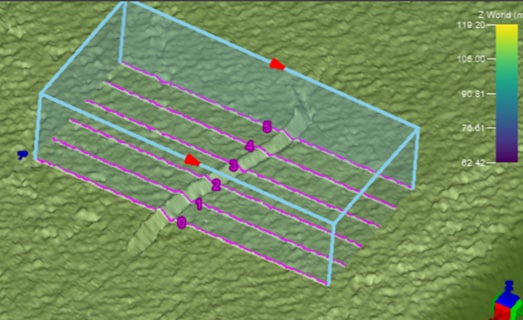
In addition, when ExtractParallelCrossSection3D is used, a plurality of profiles can be formed at once in parallel as shown in [Fig. 8], so that more reliable depth analysis is possible by analyzing using these multiple profiles.