Details
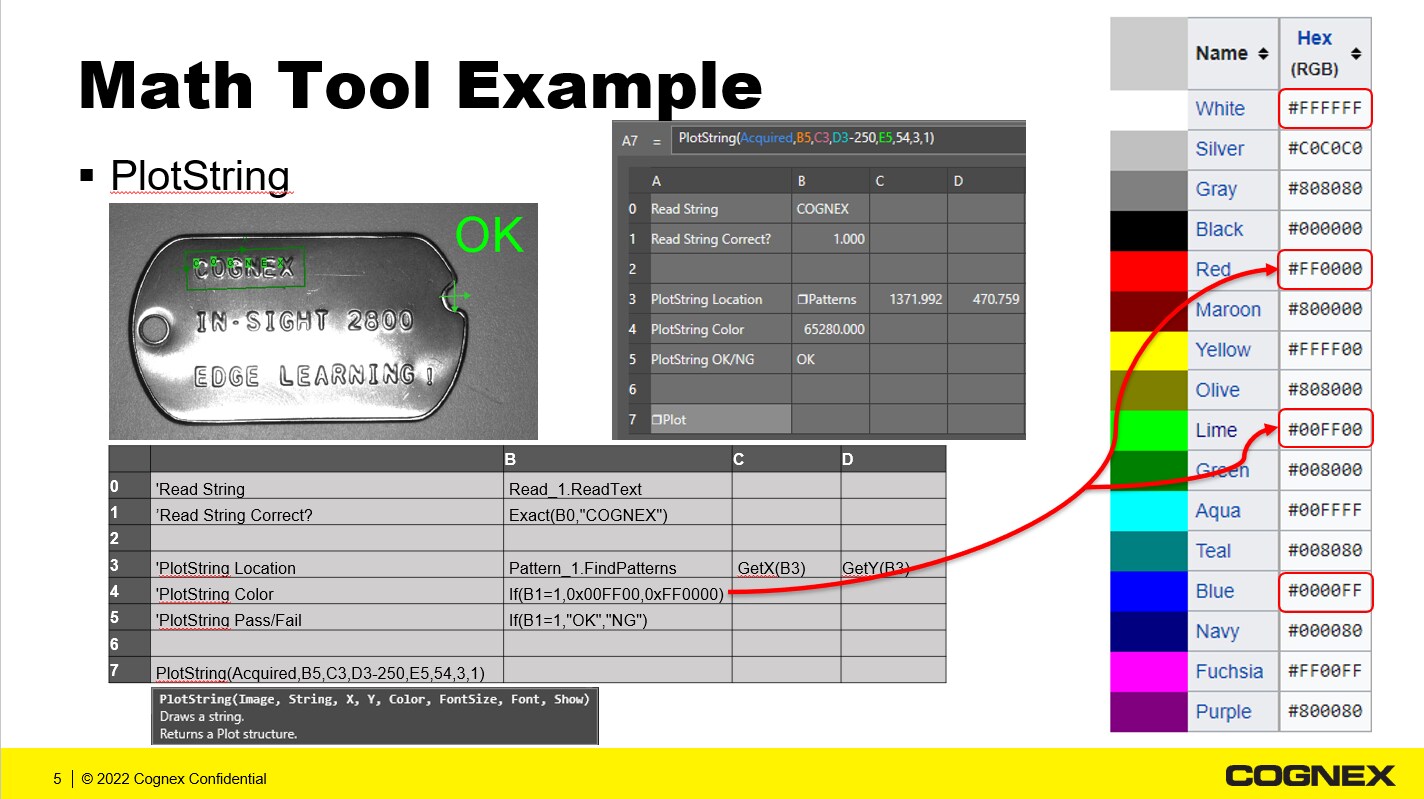
When using EasyBuilder, you can display custom graphics on the WebHMI with the Math Tool and the PlotString function.
In this example:
- Read_1.ReadText - Bring the text string from ViDi EL Read into the Math Tool
- Set Pass/Fail Bit - Using the function Exact(B0,"COGNEX")
- Set Graphics Location - Using the X,Y value from the locate pattern tool - GetX(B3) and GetY(B3) from Pattern_1.FindPatterns
- Set Graphics Color - Using the function If(B1=1,0x00FF00,0xFF0000)
- Set Custom String to Plot - Using the function If(B1+,"OK","NG")
- Now Plot the String -Using the function PlotString(Acquired,B5,C3,D3-250,E5,54,3,1)
Here is a graphical representation of this example.